


Before You Draw Conclusions, Be Sure You Know What Data Really is Telling You…Or Not
We use a lot of data analysis on our projects to help inform our decisions as we build and deploy the Heroik Growth Engine with our clients. And despite the growing amount of data worship going around, the numbers on the dials and screens are often as subjective, deceptive, and full of as many half truths as qualitative analysis. The secret to effectively leveraging data, is knowing precisely how the numbers can lie to you.
Now, before all the spreadsheet toting, extremist data fanboys start the flame war, read on to see precisely what I mean.
For the purpose of this post, we’ll be talking about one form of data analysis, web analytics. More specifically, Google Analytics. Now, Google Analytics can tell you a lot about the visitors to your website, and it can be incredibly informative. However, it’s also not perfect.
Analytics provides more insights than hard and fast truths or facts.
Don’t be fooled by marketers who tell you otherwise. Data often provides more insights than hard facts. It can signal, imply, and indicate, but rarely does it conclusively show truth. This is because there are many assumptions made in the complexities of the analytics system, and what we see visualized is not 100% raw data, but a model or algorithm’s interpretation of observations. It’s like an opinion of a really smart person. It’s still an opinion, passed along to a few other smart models that also have opinions before finally showing up as a beautiful graph or chart on your screen.
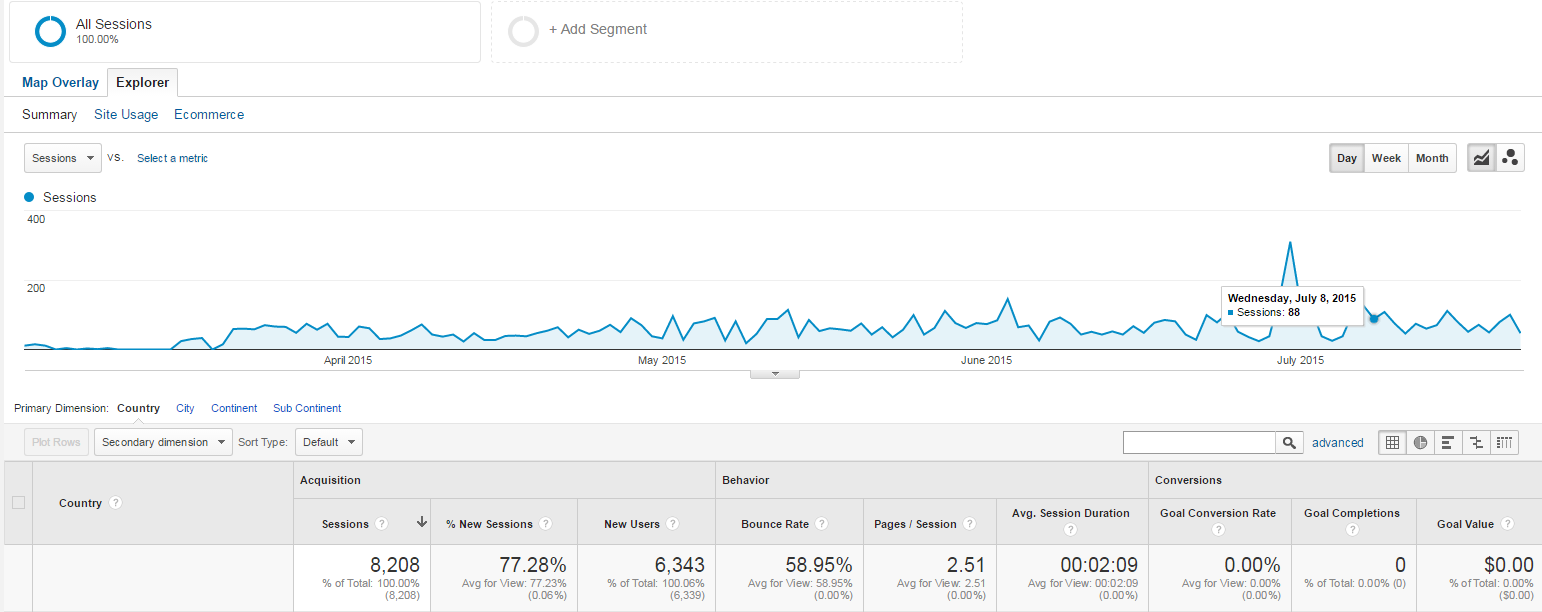
Scenario: Imagine that last January, you launched a new website for a California business, that works locally and remotely across the country. As things take off you’re trying to not only improve your web traffic but refine the business model as well. You’re new to Google Analytics but here’s what you see on your dashboard by default (which is what a majority of business owners /untrained eyes see first).
Now, imagine in the default view you saw a nice traffic chart with a bounce rate of almost 80% (the percent of people who visit the site and quickly leave).
The conclusion you draw: “People hate our prices and we’re missing out on prospects our sales team could convert over the phone”
You are instantly appalled and want to change something, like removing published pricing from the site. So you jump on your phone, call your Heroik Growth Team, and say “Stop everything. I think we need to pull our pricing model. This bounce rate is crazy.”
The data has just pulled a series of tricks on you. Or more specifically, you think you’re being told what’s important and relevant to inform your business decisions.
Then your Heroik expert calmly explains a series of important lessons:
Mistake #1: The chart looks like scientific truth but it’s an illusion. The instant we see a data visualization, our brains are primed to perceive it as not only true, but scientific fact. Take a look at that chart. In our original scenario, I mentioned a bounce rate of 80%, but on the screenshot it says 58%. Did you catch that? And if you did, which one did you believe was true? The chart, right? Why is that? The reason is, you’re primed to believe the numbers associated with graphs and data visualizations first, when in reality, I could have just as easily edited the image in Photoshop. This bias is so powerful, that just on the snapshot glance alone, you already start to draw conclusions as to the state of affairs.
Mistake #2: You have way too few data points to provide actionable insights to guide major business decisions. In the age of instant gratification, we want actionable data immediately. In our example, we only have 3 months of data on a website that is brand spanking new to the world. The previous site had very little traffic and was basically a static ad for your business. The hard truth is, you can’t assess the situation that accurately, that fast unless you want to make an uninformed decision.
Mistake #3: You’re reacting from a place of fear of what’s finally being measured without placing it in context. We’ve had clients freak out and want to change their business based solely on looking at initial bounce rates. It happens. It’s like measuring your performance for the first time and noticing you’re not as far along or moving as fast as you want. If you’re on a bicycle and you’re comparing your performance to the race cars of the Indy 500, I could see how that would scare you.But is that a fair assessment of your performance? My point with bounce rates especially: do you know what a healthy bounce rate is for a company of your size, in your industry, or similar situation? Or are you comparing yourself to a crazy standard?
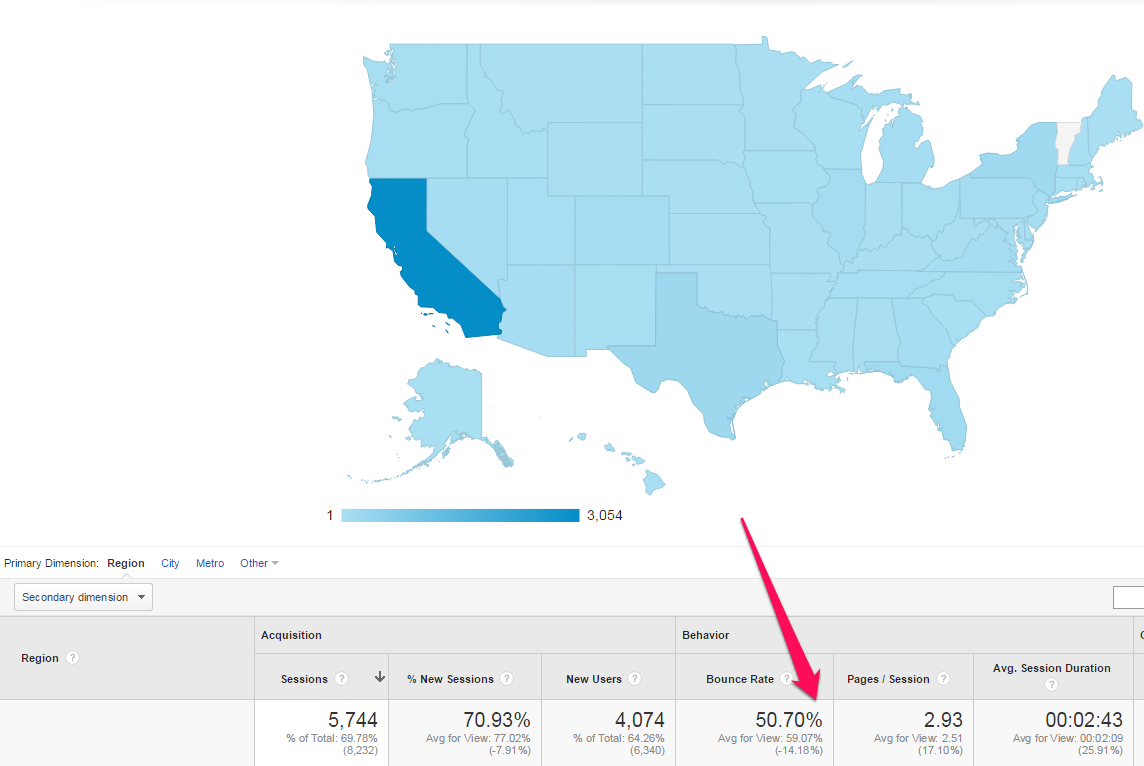
Mistake #4: You’re looking at global data for a local business with a few national service offerings. Why are you using data from outside the U.S.? If your core business is in the US, or even just one state, you may want to consider excluding other countries, and focus on what the US data actually is, before you change the way you do business.
Let’s look at just the U.S. data for a moment. Notice how the traffic graph changes slightly and the bounce rate drops?
Now let’s look at the California market, our core market in this scenario. Notice how the traffic chart changes and the bounce rate drops more?
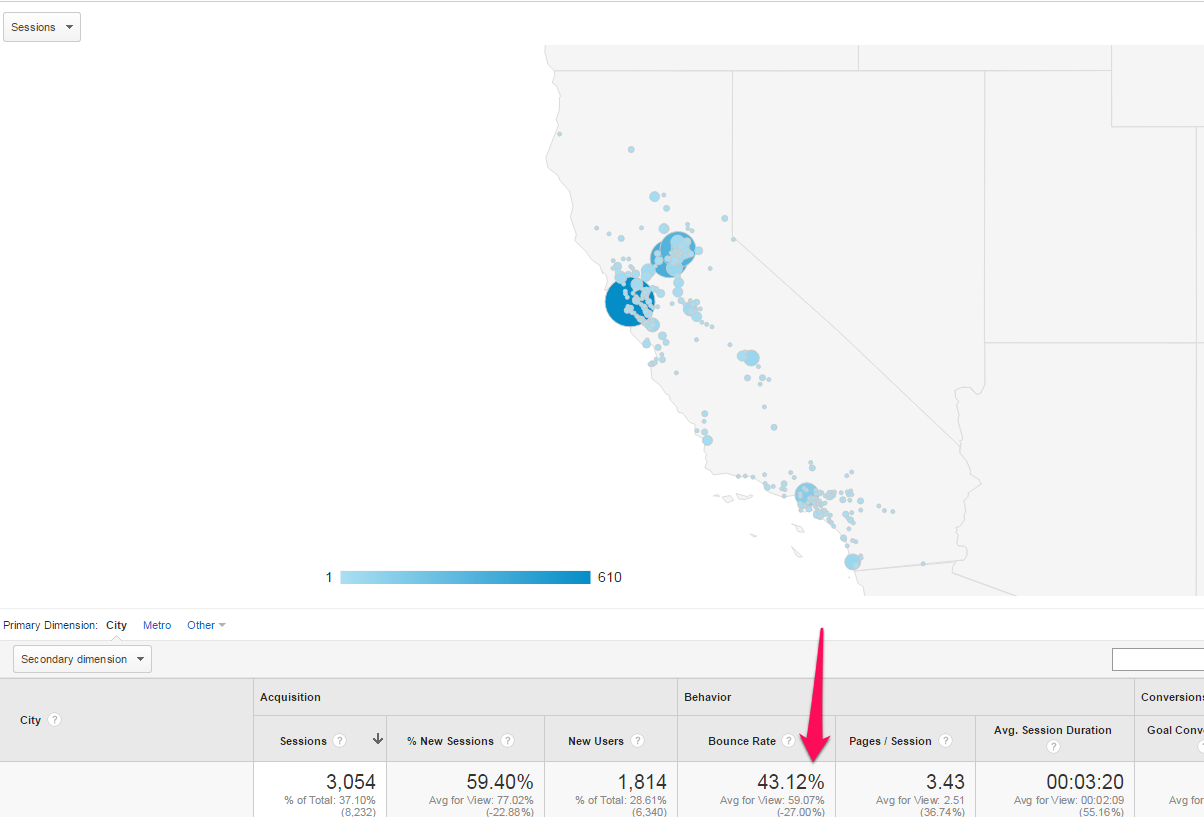
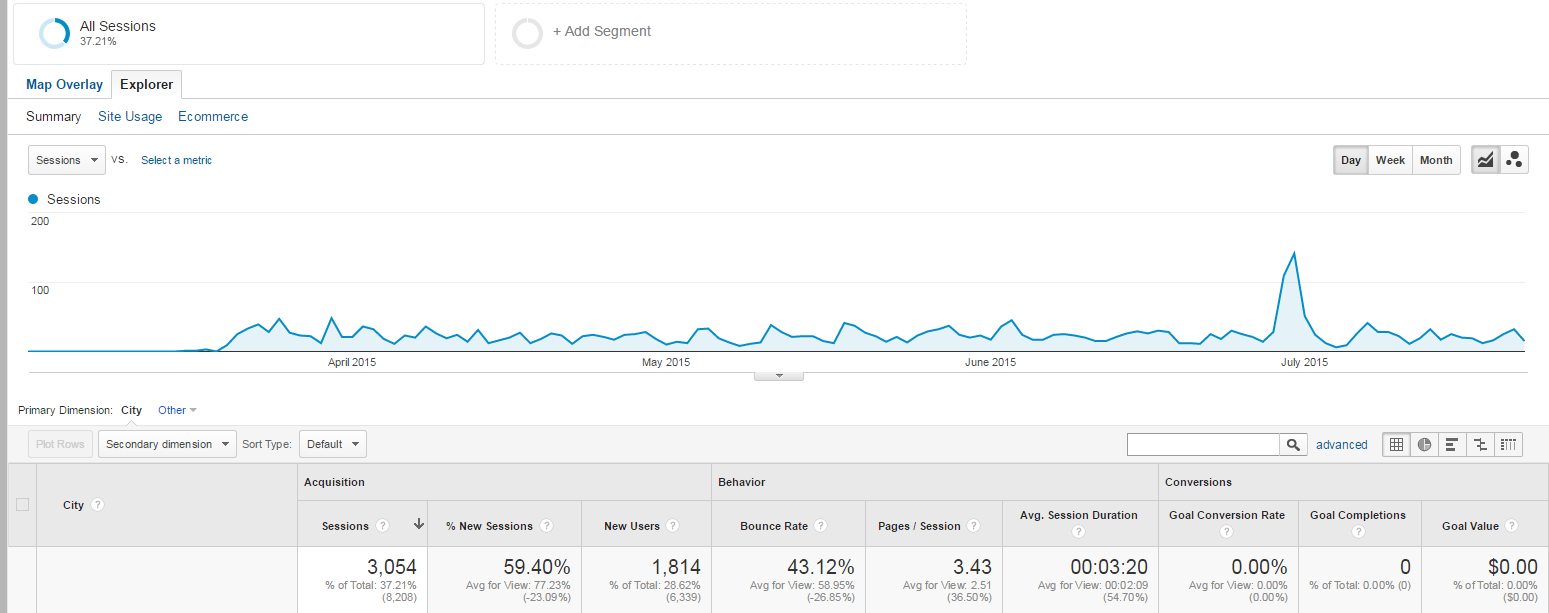
The moral of the story – armed with a limited amount of data, not knowing what you’re looking at, you can jump to some drastic conclusions and use them as cues for bad business moves. We saw an initial bounce rate of almost 60% go down to about 40% and those numbers will continue to change as things evolve and more data is collected.
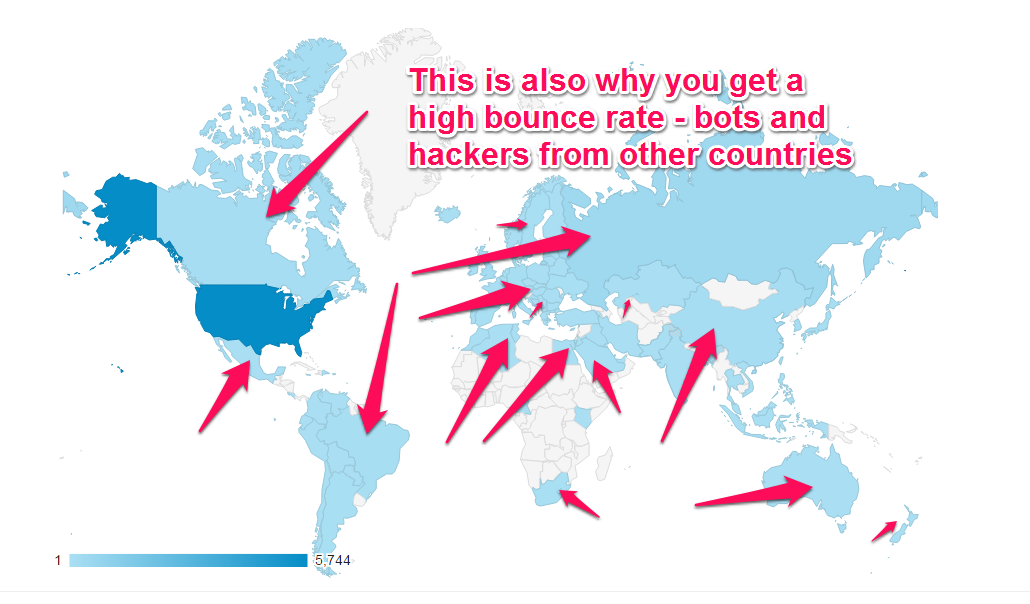
The global data or default view of data is likely showing us visitors outside of our target audience, or people we are otherwise not interested in (e.g., non prospective buyers, influencers, partners, etc.) including bots and hackers from other countries.
More Mistakes
The Data Itself Can Be Flawed – web traffic could also include web administrators, content creators, curators, and bots of all kinds. Unless you go out of your way to filter these things out, you may get a false sense of engagement from numbers that your organization itself is generating. Think about all the people on the team accessing the website at once for example. There are also bots (designed for both good and evil purposes) “visiting” your site at any given time that need to be filtered out. There are also plenty of people out there who spoof (fake) or anonymize their location and you don’t want them shaping your insights.
Summary
As briefly illustrated in our example, things aren’t always as they seem (which includes data). This is not to say that all reports are false or purposefully misleading, either. The point is, understand what you’re analyzing. Take the time to know your tools, and allow the time to collect meaningful and representative data. Only then can you make informed decisions.
6 Tips to Be a Data RockStar :
- Be more discerning with the data. It can play tricks on you. Narrow down the data to the numbers that matter. When it comes to web traffic, make sure you’re looking at the traffic that matters; the target audience in your market.
- Be cautious of using only one source of information to make a major business decisions. Even if the collection of data is accurate, it may include extemporaneous information that wasn’t filtered out which can lead you to a misinformed conclusion and a costly, erroneous business decision.
- Be patient and get a larger sample size. Get used to moving slow, like in 6 month or annual increments for beginners.
- Use other analytic tools at your disposal to get another view. Analytic tools from your other marketing and outreach efforts such as email marketing, pop-ups, opt-in forms, heatmaps, will also help build a more holistic snapshot of what’s going on.
- Look for more, better signals from your core prospective customer segments. Analytics is looking at everyone, and isn’t by default limited to just the people you care about.
- If you’re selling an expensive product and attracting a lot of people who can’t afford your product, you may see an increase in your bounce rate, but that doesn’t mean your pricing is wrong or off. It may mean you’re reaching out to the wrong crowd and you’ll want to make adjustments to your marketing efforts. And it may also be showing you for the first time, that there are a lot of people out there who are interested in what you have to offer, but cannot afford it. Think of all the people who visit the Tesla website compared to the number of people who have the means to actually purchase one.
- It’s not a fair test or analysis if you’re still making changes and building a better mouse trap. Your data can be thrown off if you’re doing any of the following:
- Implementing new security measures that filter out bots and hackers
- Adding new service pages, landing pages, and capture mechanisms
- Optimizing your website for search and social
- Taking the website offline for maintenance and upgrades
All of these things can greatly affect your data, and because you’re adding an array of new factors and complexity, it makes the historical data moot. Settle into a solution you are confident with and stick to a strategy. Commit to it for a YEAR. Most marketers don’t want to tell you that you have to make such a commitment to know what’s really going on, but it’s the God’s honest truth for most businesses. If you’re constantly changing things ups, you can’t get a fair read on what’s going on, how to address, fix or refine the smaller issues, and you won’t enjoy Heroik results.
If you have your own data horror story or glory story, tell me all about it – shoot me an email nmcgill@getheroik.com – And if it’s a good example, or just funny, I’ll publish it and promote you.


0 Comments